Noa Miller
MSc Statistics
Hello, my name is Noa Miller and I am a Data Analyst with over 10 years of professional experience in the consumer goods, transportation, automotive and electronics components industries.
Throughout my career, I have had the honor of working for and gaining experience at global companies, such as A.P. Moeller Maersk Line, Aldi Süd, Varta Consumer, Bridgestone, and Arrow Electronics.
This webpage introduces you to a collection of portfolio work in data science, machine learning, and visualization projects. My work method is characterized by a solid understanding of statistics, Bayesian thinking, and pragmatism coupled with strong collaboration and problem-solving skills.
Data Science
This is a
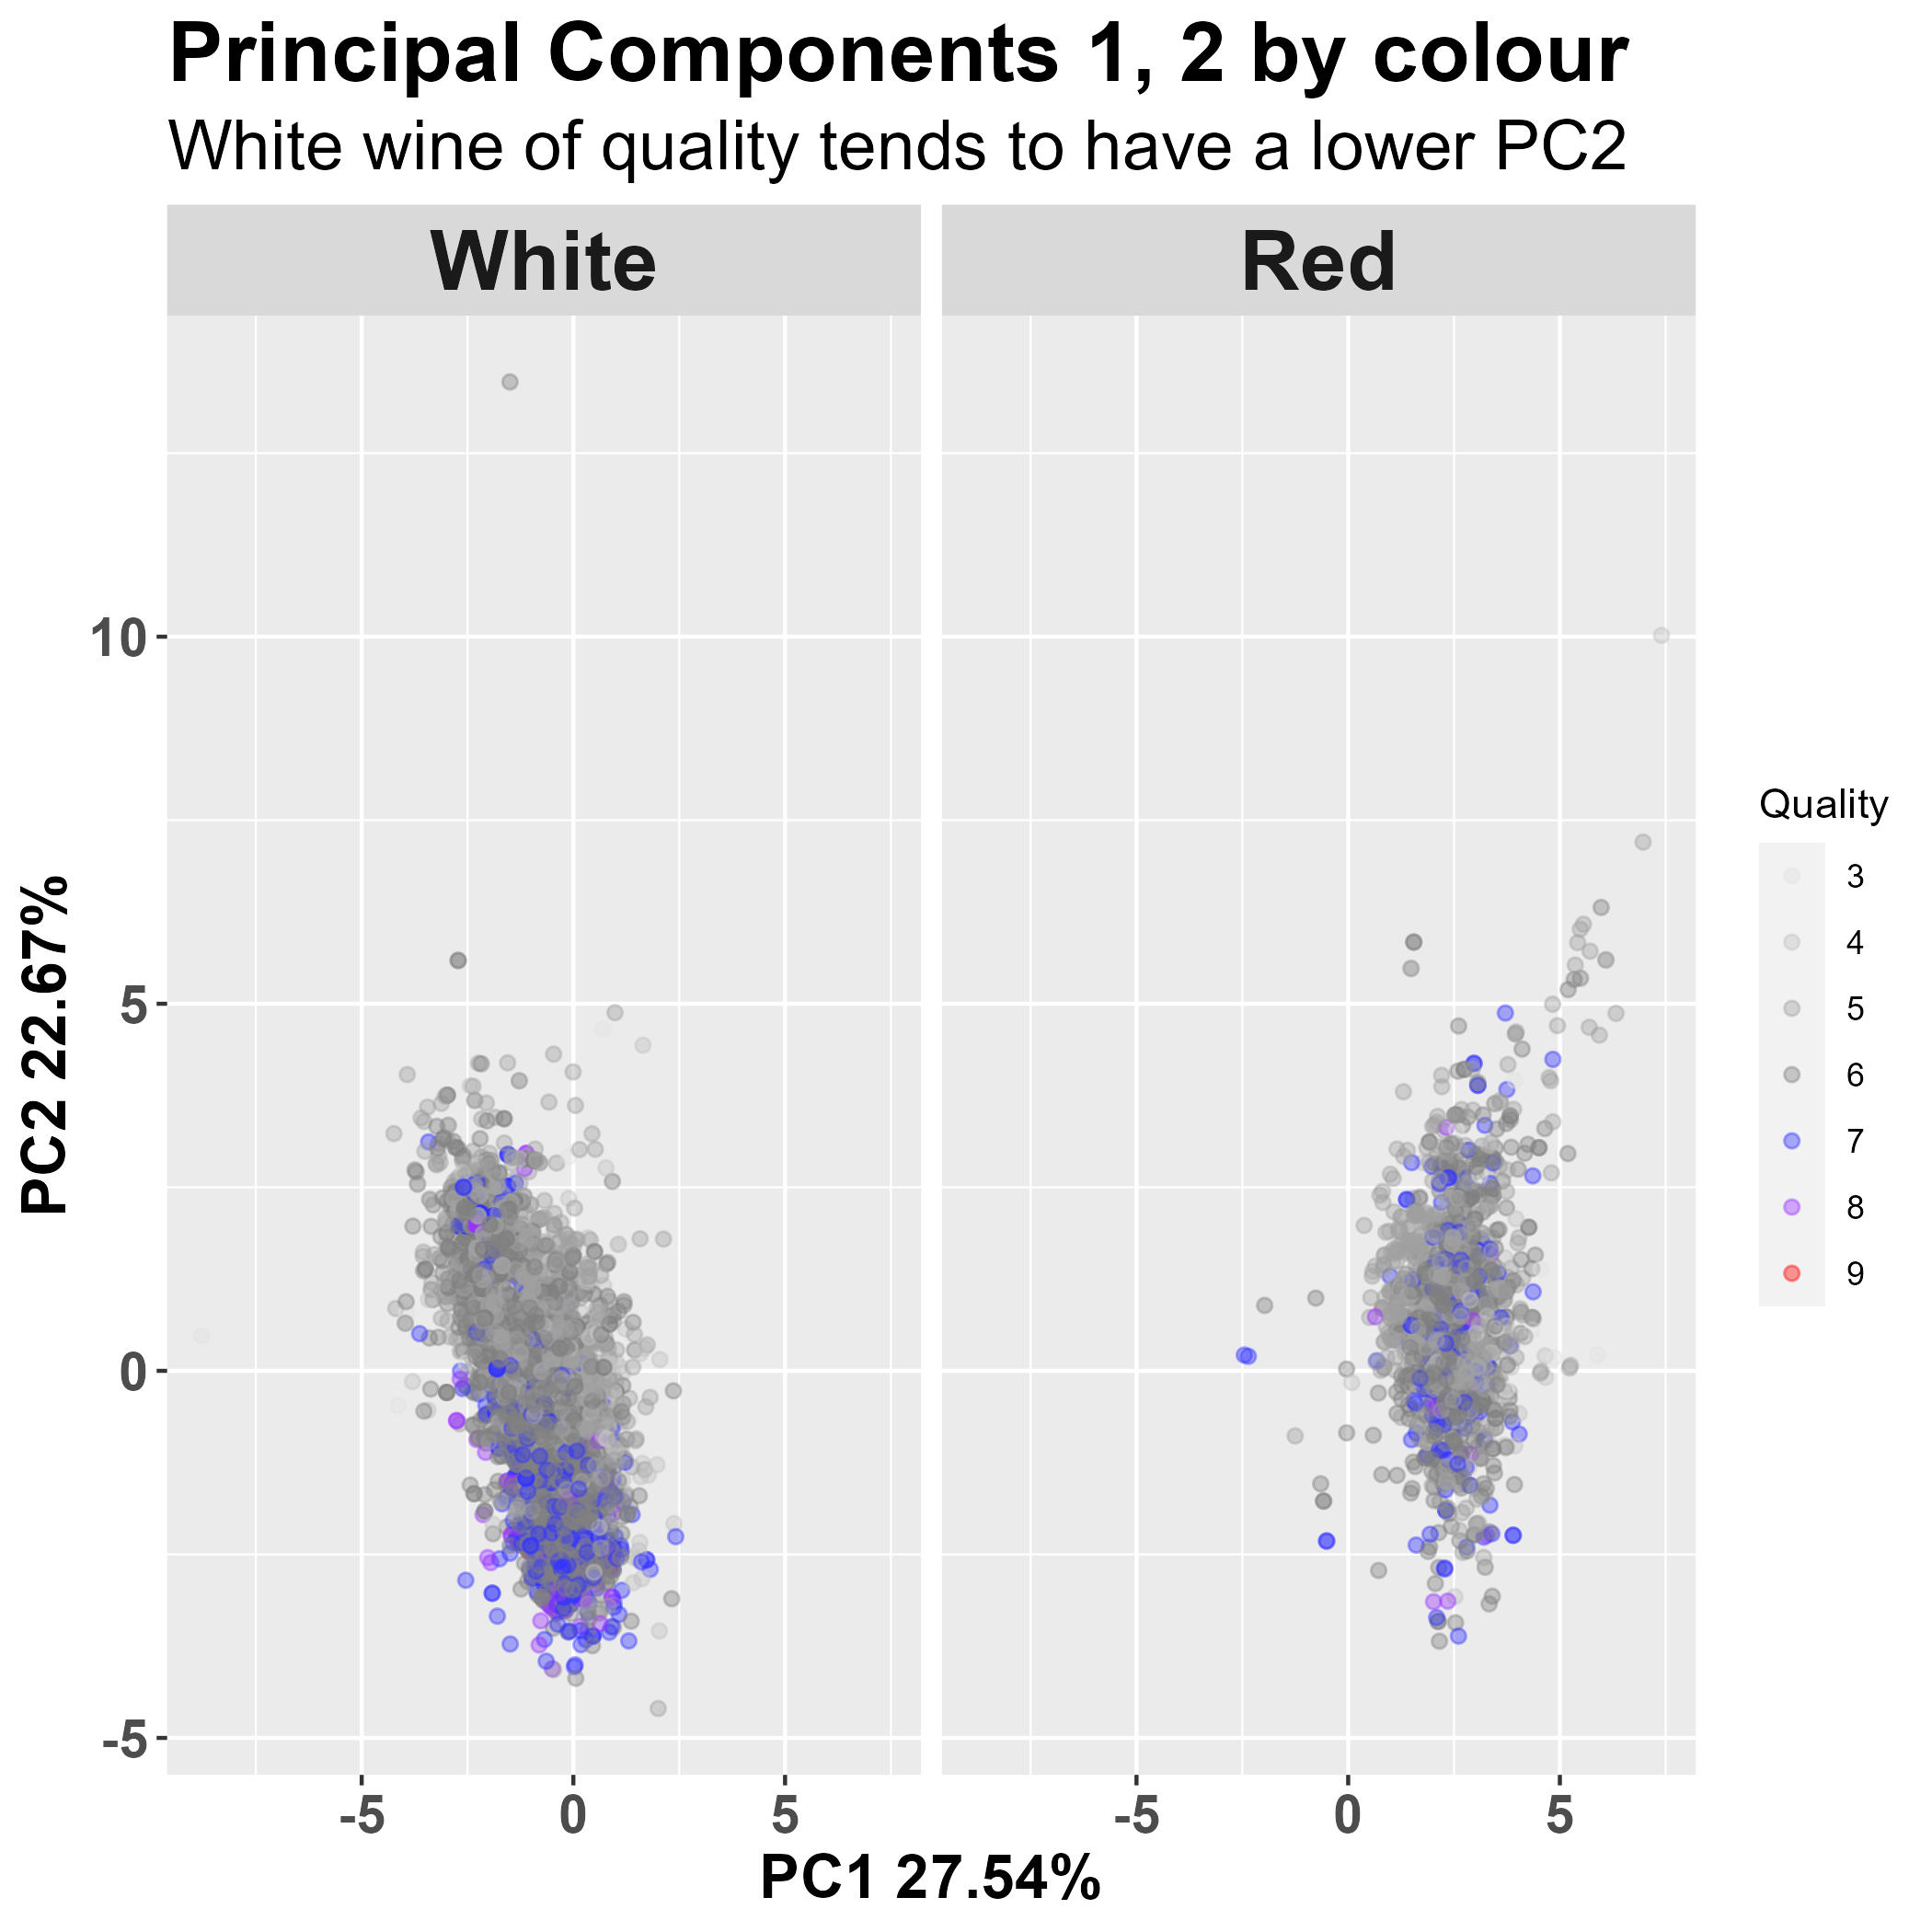
Principal Component Analysis of about 6,500 wine observations
by colour and quality, and an exploration of the chemical differences between red and white wine. The study explores that white wine is more likely to get a top quality ranking than red wine, and a Hotelling's T-squared test
yields further insight in terms of differences between mean acidity, pH value and residual sugar level.
This project is about multiple data imputation conducted on medical insurance data using the MICE package. The study fits a linear regression model to various factors, such as smoking status, bmi index or age and compares model performance between multiple imputation methods. It explores the importance of selecting the right imputation method that best fits the data at hand. Failing to do so will likely lead to distorted parameter estimates, hence affect the model's predictive performance on unseen data.


 AWS Cloud Certificate
Microsoft MTA Certificate
Machine Learning
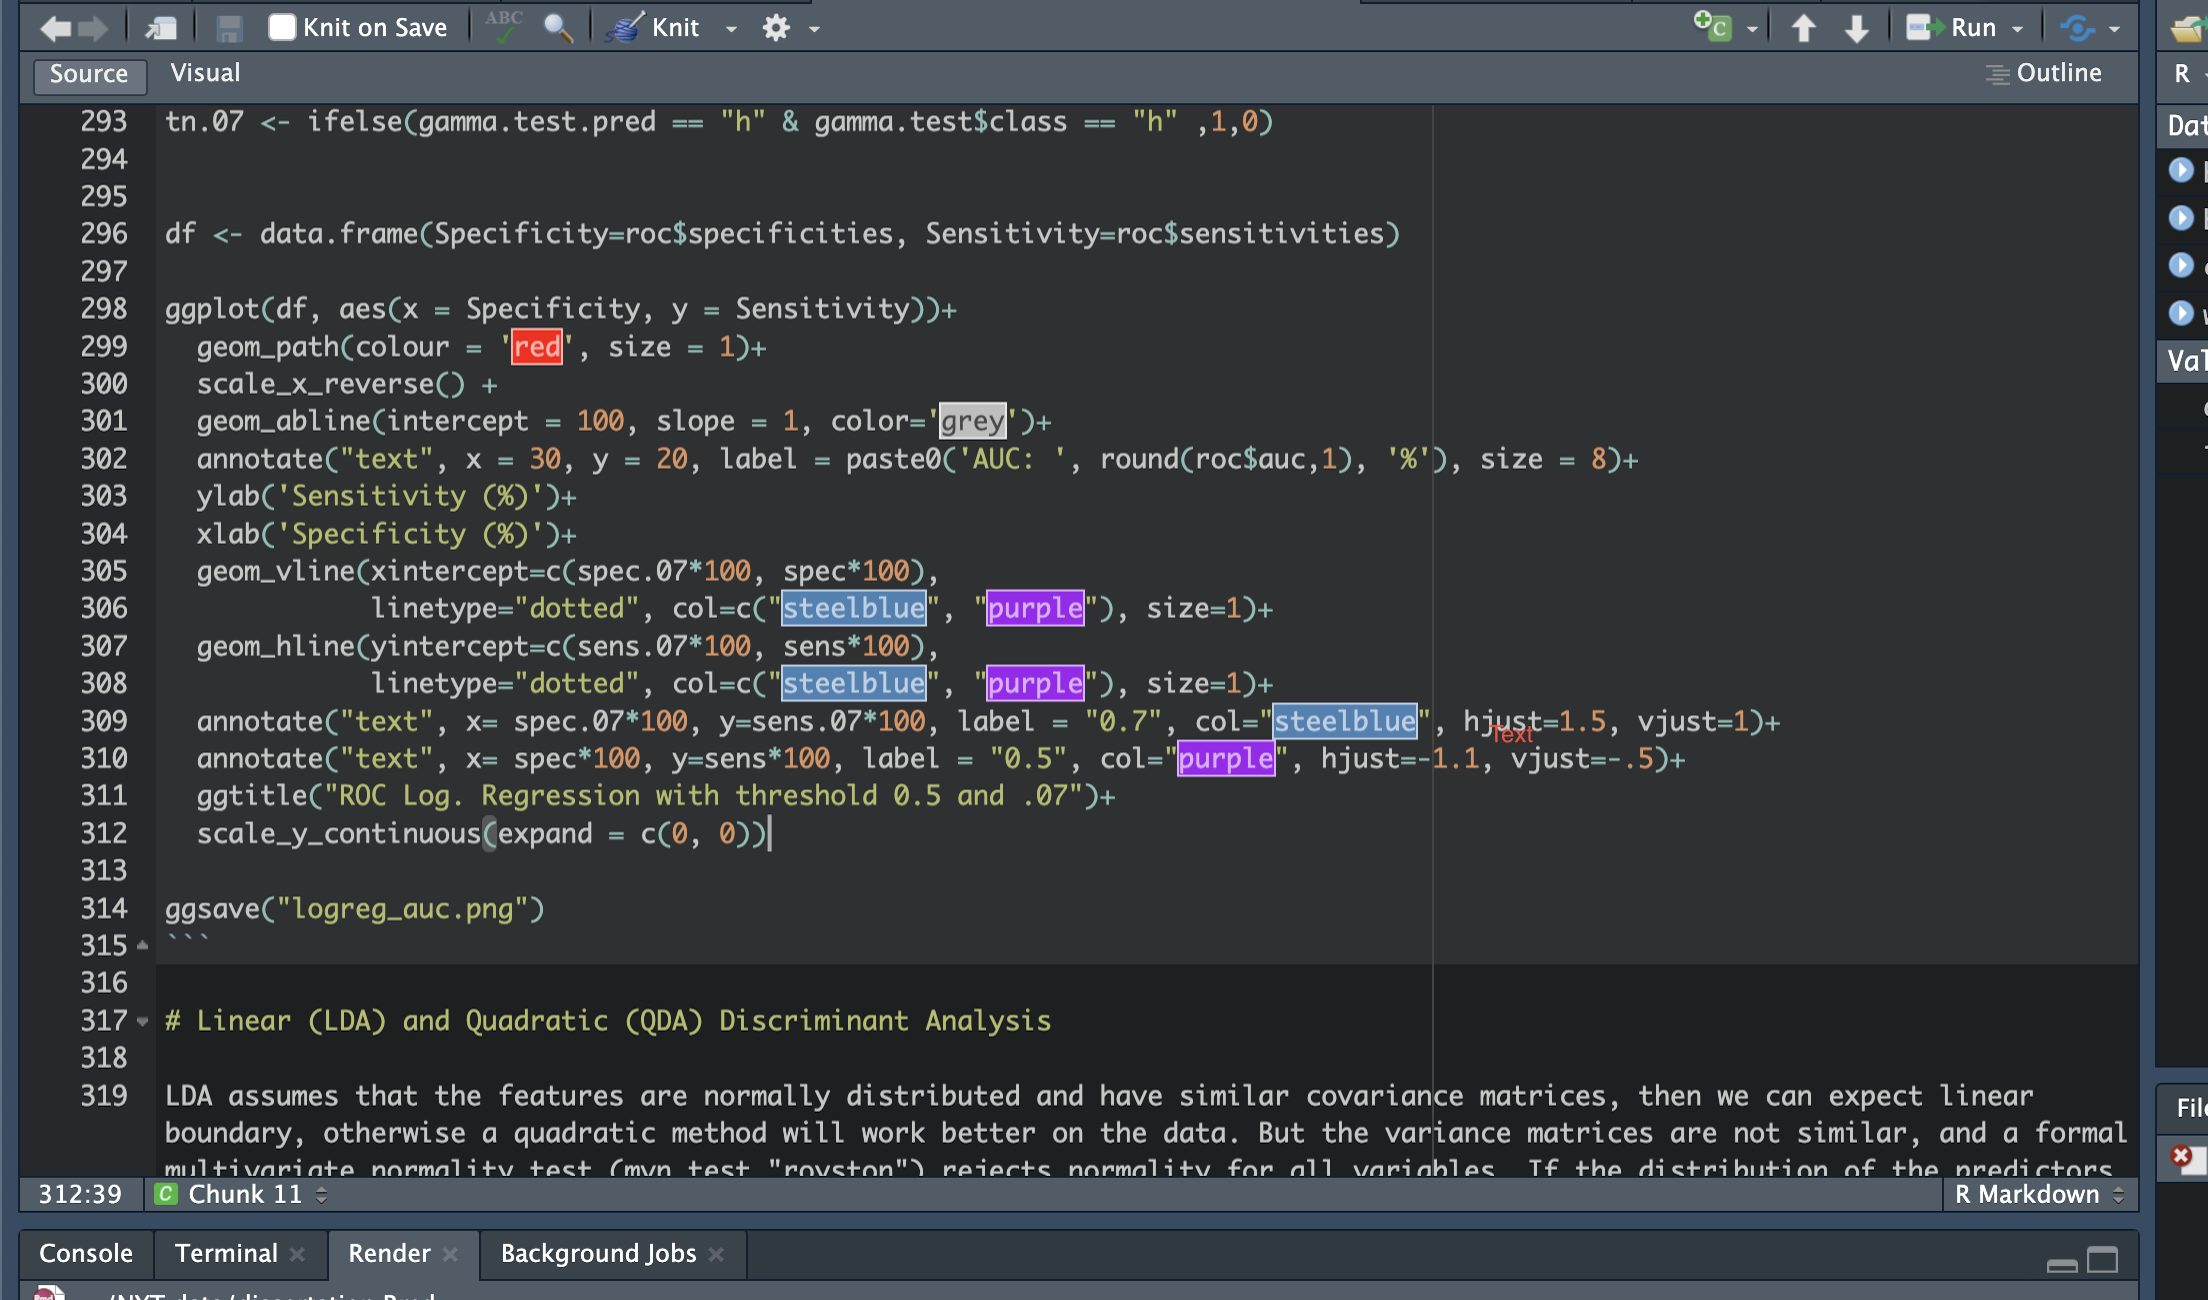
This project is about a Machine Learning
model selection
with the objective of maximizing prediction accuracy when distinguishing gamma versus hadron particles from an electromagnetic shower.
The R code fits
several models, starting with LDA (Linear Discriminant Analysis), tree based models, SVMs (Support Vector Machines) as well a a Neural Network. The best result was given by an XGboost Tree with a prediction accuracy of about 0.855
when labeling gamma vs hadron particles.
Visualization
In this section, you find a portfolio of Power BI reports visualizing and interpreting data sets, such as the Global Temperature increase between 1995 - 2019, the research performance of a simulated biotech company Scientise or an analysis on brand performance of an Appliances business.
 Power BI Certificate
Web Scraping
This Pyhton code scrapes www.bbc.com for any articles related to Africa, opens it in your browser window, and automatically saves the URL to a MySQL Database for reference. The script can be easily customized and amended to suit other keyword or search preferences. You find the code in my GitHub repo here.

Automation
This VBA code was written for a Microsoft Office-environment to create and distribute personalized reports as excel attachment via push emails. It enhances performance tracking by providing a customized task overview into assignees' Inbox. You can download the source code to view and run it by clicking here.

